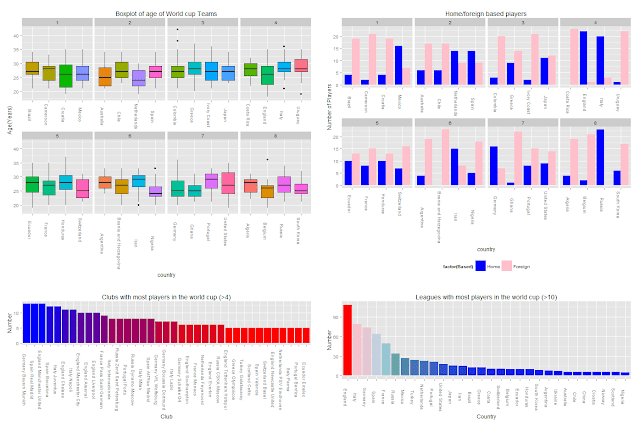
The data and script for this post can be found on this gist . The data is taken from wikipedia(http://en.wikipedia.org/wiki/2014_FIFA_World_Cup_squads). The script analyses the data to create interesting charts about the 2014 world cup squads. Charts include box plots of age, number of home/foreign based players for each country, clubs with more than 4 players in the world cup and leagues with more than 10 players in the World cup.
The data shows that the youngest team is the Netherlands(Dutch) team. Only Mexico, Netherlands, Spain, England, Italy, Russia, germane and Iran have more home-based players than foreign based players. Most teams have less players based in their home countries. The European clubs dominate the number of clubs with the most players in the world cup (again not a surprise)!! The world cup 2014 appears to be a sort of "European Cup"!!
Links to the scripts and input data
R by Emmanuel Jjunju
Thursday, 29 May 2014
Thursday, 20 February 2014
Control R from Excel
Here is a simple script modified from univie.ac.at that you can just run in R. Follow the instructions in the ensuing dilaogue boxes after running the script.
This RExcel interface will help you if you tend to work with people whose knowledge of R is weak but you want them to be able to use R-scripts that you share with them.
And the result: A new toolset complete with R_menus under the Addins Ribbon in Excel.
More customisations are described on univie.ac.at. Other
ways for working with R and Excel can be found here http://www.r-bloggers.com/a-million-ways-to-connect-r-and-excel/
Friday, 14 February 2014
Curve testing and fitting in R
I have found this post to be very useful;
Thursday, 13 February 2014
Install and load missing specified/needed packages on the fly
This is a short script to help installing packages on the fly.It is most useful if you are distributing a set of script files to people who may not be aware that the needed packages are not installed on their systems. It is also useful if you use many packages and want to organise their installation (if missing) and/or loading at the beginning of a script.
Enjoy:
Enjoy:
Wednesday, 12 February 2014
Digitizing jpeg graphs in R
I have been using third party programs for a long time until i came across the documentation for the R-package digitize. unfortunately, this package is not available for R 3.0.2 so i had to tweek things around. I am glad to share my solution.
I started by taking a look at http://lukemiller.org/index.php/2011/06/digitizing-data-from-old-plots-using-digitize/. Luke Miller has written a very nice description of how to use the digitize package. Some of the text here presented is from Luke Miller.
The digitize package by Timothée Poisot actually relies mainly only the functions readImg, ReadAnadCal, Digitdata and Calibrate. ReadImg requires readJPEG from the jpeg package. Once the jpeg package is installed and loaded, then just load these functions craeted by Timothée Poisot. The functions can be downloaded from https://github.com/tpoisot/digitize/blob/master/digitize/R/functions.r
The code snippet below shows my implementation. I have added the use of the tcltk2 package so that one can browse and select the the jpeg file directly.
Subscribe to:
Posts (Atom)